WHY IS VISUAL CONTENT SO IMPORTANT?
Dissemination is a contractual obligation in Horizon 2020 and it is a key task for giving your project visibility and spread your results to your target audiences. However, how well are you disseminating your main messages and results?
It is more often that we read about the continuous evolving ways of consuming information, having visual content as the main tool with a rapidly growing power and value. Photos, infographics, GIFs, illustrations and videos, are just a few forms of visual content that are having a huge impact on the way people consume information. All of these visual assets will only continue to grow in importance over the next few years and you must adapt your content strategy because what are communication and dissemination if not retained by your audience?
Transmitting your results in a digestible format by integrating visual content can boost how much your audience absorbs and remembers. The more visually appealing and interesting content, the higher the chances to be shared by other users and thus, of reaching wider audiences. That’s why we have created a series of blog posts with tips and tricks to ease your way and go visual!
For this first blog post, first, we want you to understand why visual content is so important!
Different studies have assessed the power of visual content. An example is the study from the content platform Skyword which concluded that content with relevant images gets 94 percent more views than content without. In social media there are some stats as well:
As reported by eMarketer, Facebook posts from brands that included images earned 87 percent of all engagements. As reported by Buffer, tweets with images receive 150 percent more retweets. In general, in social media, posts that include images produce 650 percent higher engagement than text-only posts.60,000 times faster than it does text. We take in visual content faster and more effectively than words. In fact, ninety percent of the information sent to our brain is visual, so naturally, we’ve been trained to consume visual content as quickly as we can.
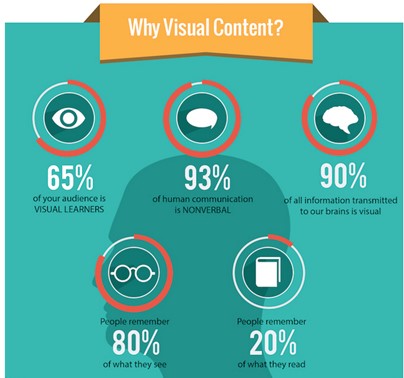
Furthermore, attention spans are changing. As nicely compiled in an infographic from WebDAM, 8 seconds is the average amount of time before a person gets distracted. And this happens regardless of your level of education. In fact, 81% of educated people skim text online instead of reading it, and on average, people remember only about 20% of content with only text and no visuals.
If you don’t have a designer available to work with you, there is nothing to worry about, we got you covered!
Next week we will post the detailed tips and tools that will help you convey your message better, we will focus on branding, on creating a visual identity and we will provide many resources, so keep an eye on our blog! We assure you that you won’t want to miss it.
But in the meantime, not to leave you dry, let us share with you one of our forever and always favourite:
CANVA!
Canva!! If I would have to choose one tool that would help me on creating highly visual content in graphs, presentations, banners, flyers, posters and so on, it would definitely be Canva. It is free to use, user-friendly, it has many templates, and everything done there just looks perfect.
If you haven't already, check out our next GO VISUAL posts of this series: