If you remember from past posts, we created a series on the importance of going visual when communicating and disseminating your results to your audience. On our first post, we discussed why visual content is so important, whereas, on the second one, we explained how to create a visual identity for your project, and we showed some in-house examples.
Now, as a wrap-up of this series, we would like to give you some tips on what to consider as well as some top recommendations for online and -mostly free to use- resources that will boost your visual identity significantly. Let’s get started!
TIPS & TRICKS
CONSISTING VISUAL IDENTITY
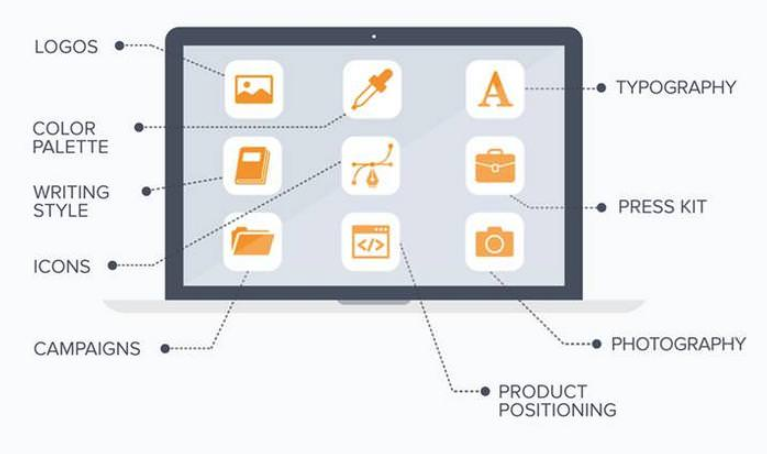
It is important that you consider the visual identity of your project across all touchpoints:
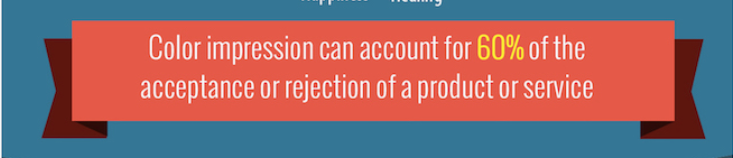
If you are just starting to create your visual identity, then you can use Colormind or Coolors for creating a consisting colour range. These scheme generators will suggest you colour palettes from scratch or based on one or two colours you want to use. They can learn colour styles from photographs, movies, and popular art as well.
VARIED TYPE OF CONTENT
Visual content can come in different ways: eye-catching creative photography, videos, screenshots, infographics, memes, data visualization, comics, visual note-taking, story maps, mockups, live videos, vectors, illustrations and so on.
For you to maintain a variety of content that will keep your audience entertained, we give you some recommendations below:
EYE-CATCHING PHOTOGRAPHY
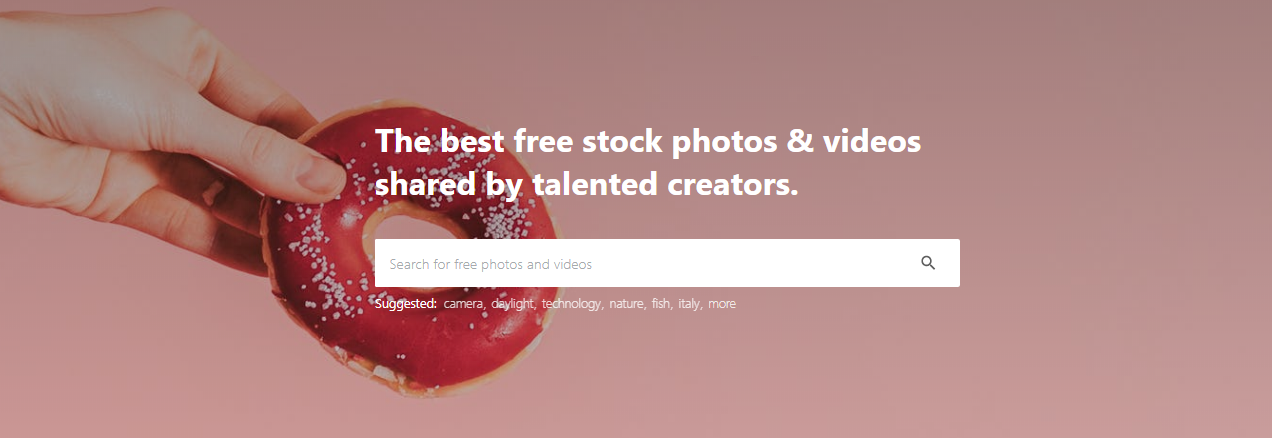
Stock photos are a great source of high-quality visuals. In most cases, you need a subscription or to pay per photo downloaded. Shutterstock is the most famous one and offers one different high-quality photo every week for free.
However, Unsplash and Pexels are the best free stock photos & videos databases where a community of talented artists keep feeding it with content. When using content these websites just remember one thing: always give credit to the photographer (is a way of thanking them for letting you use their content for free!) and when possible, tag them to help promote their work.
VIDEOS
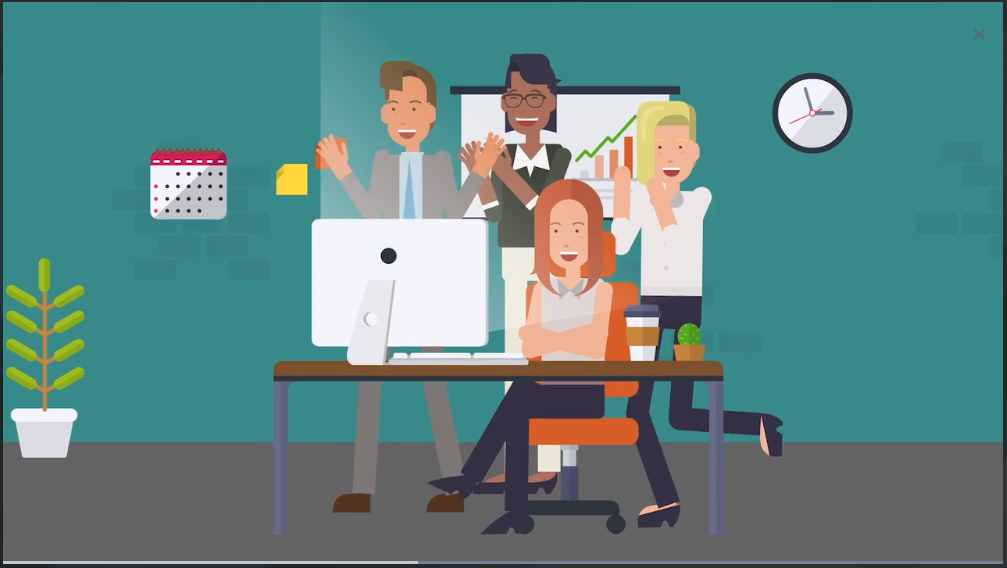
You can also find clips in Shutterstock on a very wide range of topics. Similarly, you must pay for each clip downloaded. The problem with this is that for making a 3-minute video you would need many clips and the prices would just rise up. Recently, we have tried online video makers for animated clips like RawShorts and Vyond. These platforms are very easy to use as they have a library of templates, sounds, props, and so much more that cuts your production time and increases the quality of your visuals significantly.
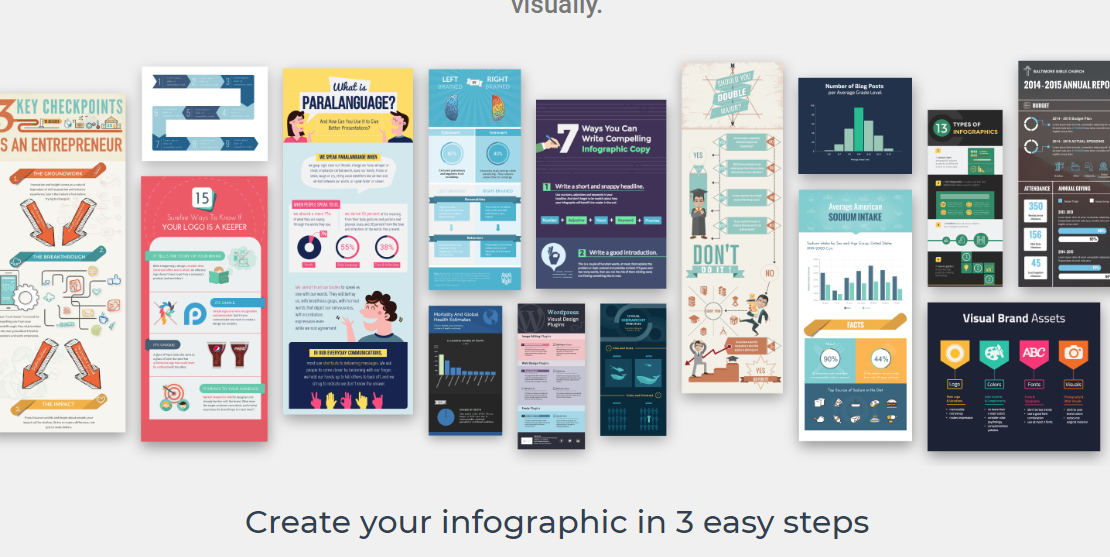
INFOGRAPHICS
One of my favourite ways of presenting data and probably of many more people as the available online infographics’ makers are many. You can try Visme, BeFunky or Snappa where you will find beautiful templates and ready-made building blocks to easy your workflow. Some of them have the cool feature of collecting valuable insights as they track and analyse the engagement generated by your infographic.
MEMES
Well, this one is rarely used on H2020 projects as it could look rather informal. However, you can design many creative works with this format. You can explore ImgFlip.
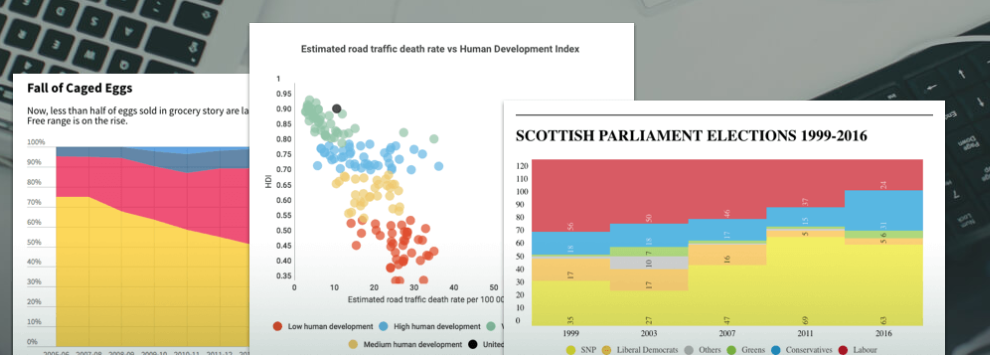
DATA VISUALIZATION
Create charts, graphs, maps and many other graphics for presenting your data in an appealing way. There are many tools out there but we could recommend Infogram or ChartBlocks. Although using iWork or the usual Microsoft office is also recommended if you follow your colour palette and visual identity that you generated.
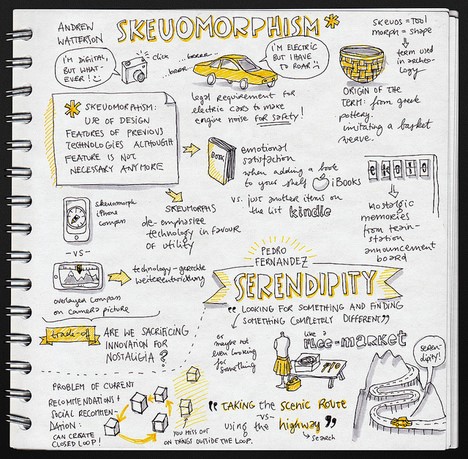
VISUAL NOTE-TAKING
Casually-designed layout of ideas, typically text-heavy can be very visually appealing as well as it implies a process of “visual thinking”. However, you need to be more skilful to make it effective. You can read a very complete article about sketchnoting here for understanding how it helps, or this other one for learning how to do it.
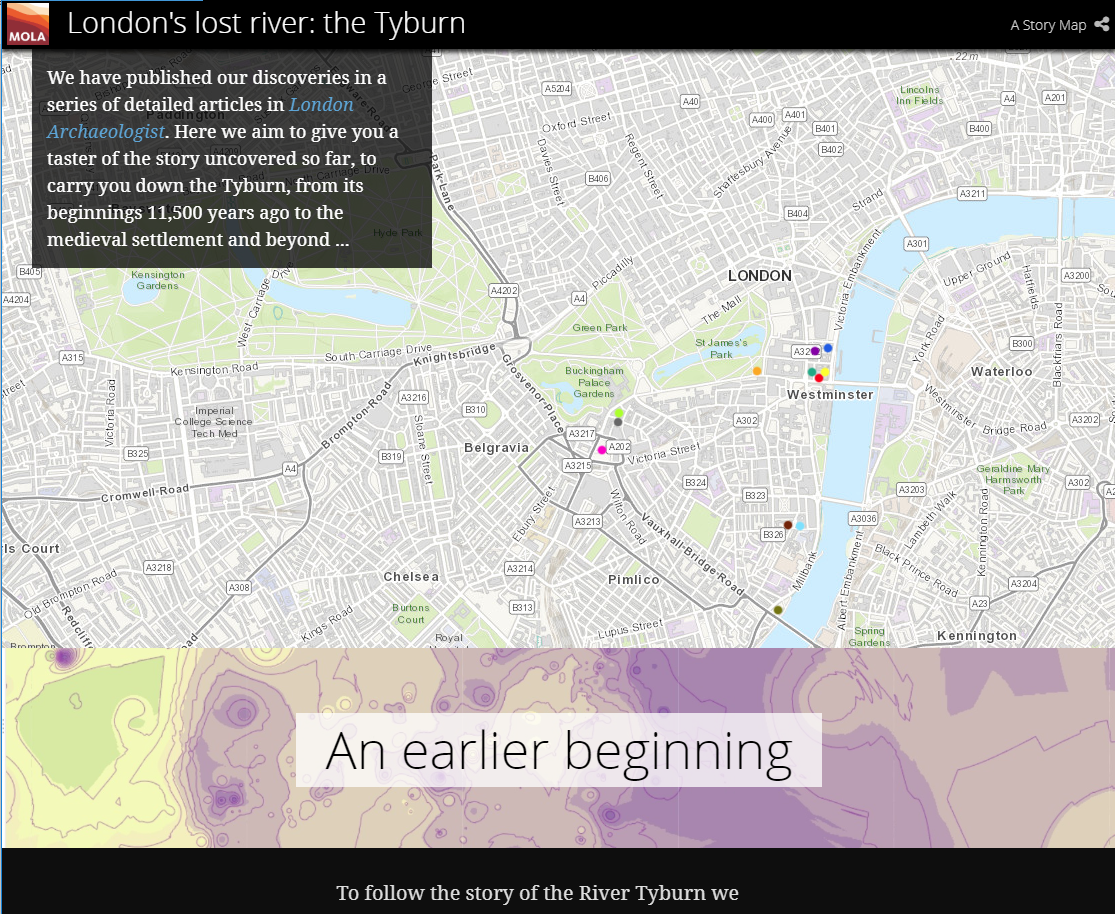
STORY MAPS
This is a tool developed by ESRI that lets you combine authoritative maps from ArcGIS with narrative text, images, and multimedia content. At their page, you can see many examples of story maps and get inspired to create your own.
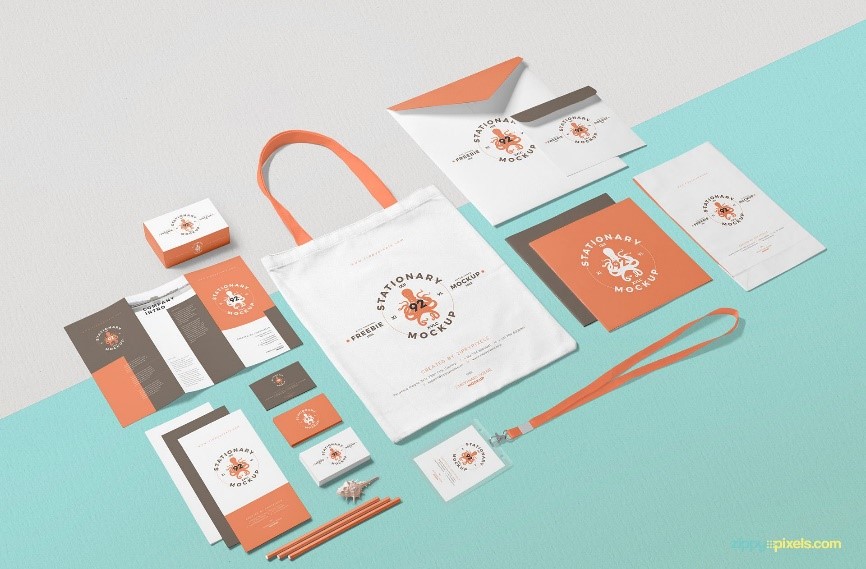
MOCKUPS
Did you create dissemination material? Maybe instead of taking a photo of your flyers you can insert the design on mockups to make it look as if they would have been taken in a professional photographic studio. In ZippyPixels you can download many different mockups for free.
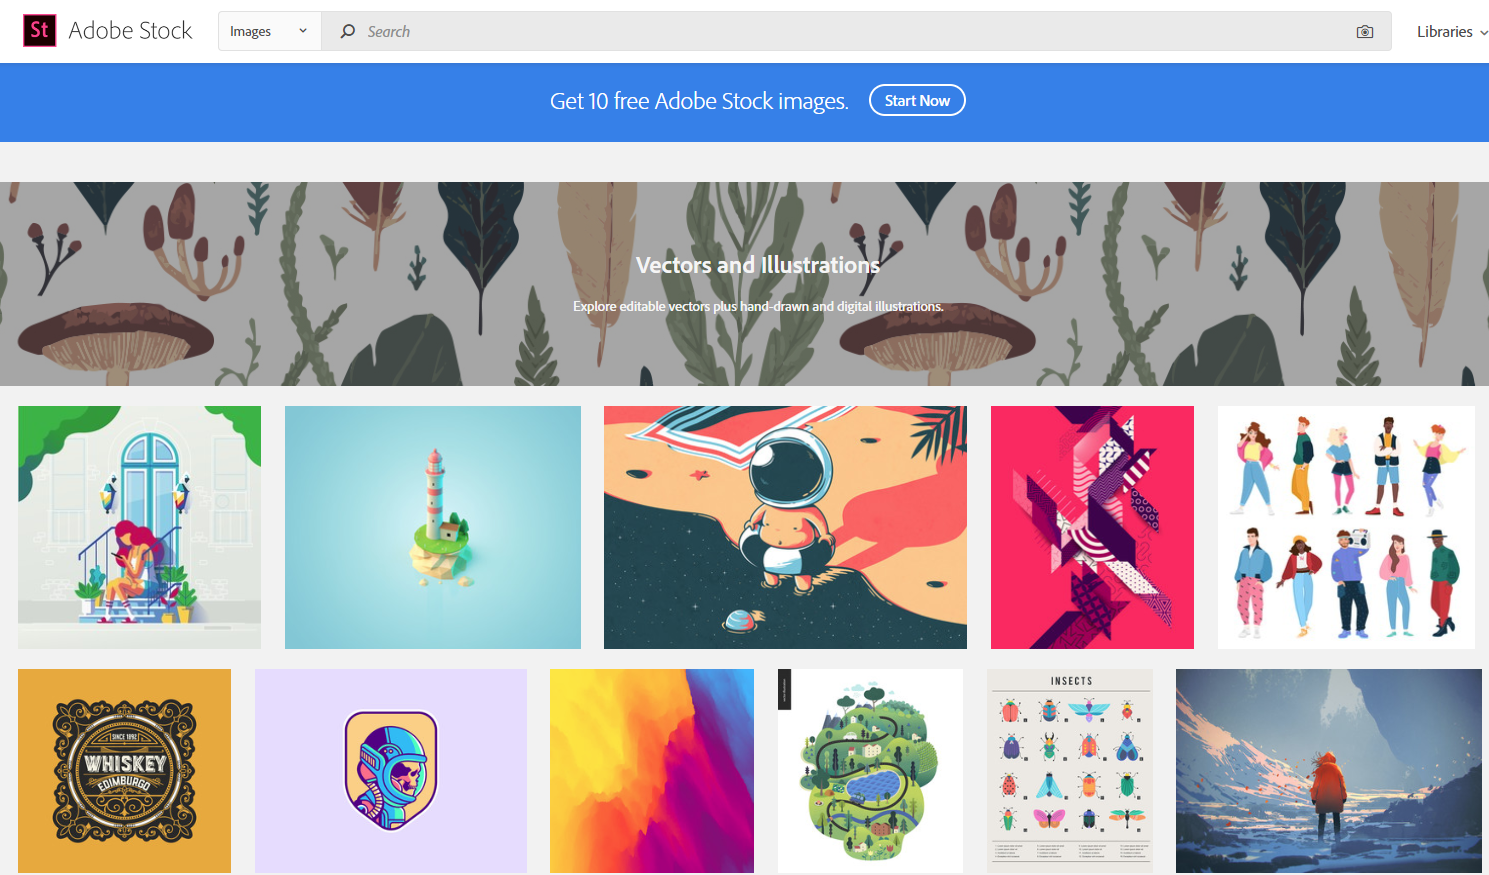
VECTORS AND ILLUSTRATIONS
You can also find many sites with stock illustrations like in Adobe Stock or iStock websites.
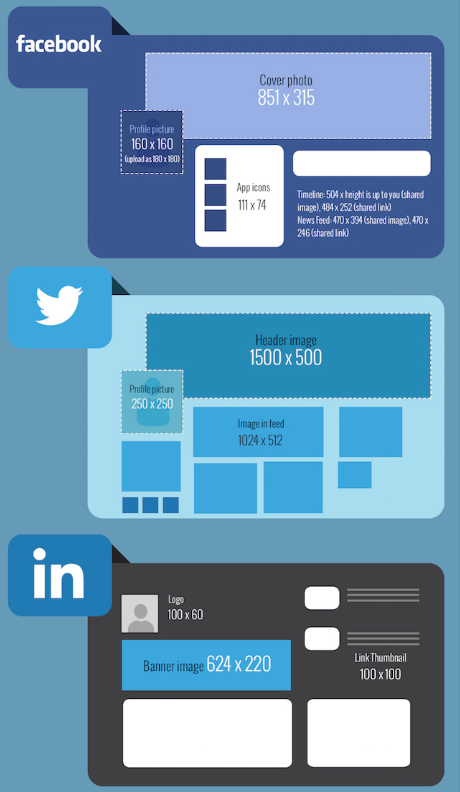
PROPER FORMATTING
Lastly, a very simple thing that it is very common to forget: all social media require different image sizes. It is horrible to enter to Twitter and see half of an image because we used the same format as in Instagram. Follow the size cheat sheets so they look good on your networks. Here are the most common social networks but you can find others in the infographic created by Hubspot.
OTHER RESOURCES
To finalize, besides the resources mentioned under the tips above, we have some other useful online tools you might want to check out.
If you don’t want to produce the content on your own, you can hire some good freelancers through this website. They advertise themselves as producers of high-impact content with products centred in videos, infographics, ebooks, reports, presentations, photography, social media and interactive microsites.
This is an easy-to-use design editor tool to create or customize photos for social media, digital ads, websites & blogs, print materials, covers & headers, business & more. Similar to Canva, it has the great advantage of designing everything in the cloud, so you basically can access your work anytime from anywhere. Depending on how often you want to use it and how many libraries and templates you want to access, it can be free, or you can pay a monthly subscription.
And just a reminder of our all-time favourite which we showed you on our first post:
Creating highly visual content it’s just so easy in Canva. From presentations, banners, flyers, to graphs, posters and social media posts, Canva just makes everything so much easier and it is free to use.
We hope you found this post useful, and if you have more resources that could fit into this post, please contact us to include them at
Thanks for reading!
If you haven't already, check out our previous GO VISUAL posts: